US Jobs Streak: Now Second Longest in 86 Years
What is amazing about this most recent jobs report is that it makes the post-COVID US labor market (Jan. 2021 to Dec. 2024) tied for the second longest streak of consecutive positive monthly employment gains—48 straight months—in the last 86 years.
In a time when inflation pressures, high interest rates, and fiscal worries cloud the economic horizon, the US labor market is a bright spot of strength, resilience, and consistency.
The December 2024 US employment report came out last Friday, January 10, 2025.1 It showed a continued monthly increase in US nonfarm payroll employment of +256,000 jobs in December 2024, which is pretty close to the average monthly job growth over the last two years (+218,542 jobs per month). But what is amazing about this most recent jobs report is that it makes the post-COVID US labor market (Jan. 2021 to Dec. 2024) tied for the second longest streak of consecutive positive monthly employment gains in the last 86 years—more specifically since 1939.2
Figure 1 below shows the time series of total US nonfarm employment (seasonally adjusted) from 1919 to 2024. This figure shows the total number of employed workers, not the change. The total number of workers in the December 2024 report was 159.5 million. This compares to 90.8 million workers in January 1980 and 29.9 million in January 1939. You can see that periods of declining employment are associated with recessions. You can also see that the long-run trend is positive employment growth—average +0.14% per month and average +1.75% per year over the 1919 to 2024 period.
Figure 1. US total nonfarm payroll employment, monthly, seasonally adjusted, 1919-2024
If you look at all the monthly changes in employment—current month total employment minus the previous month total employment—some are positive (employment gains) and some are negative (employment losses). The average monthly percent change in employment over the entire time series is a monthly employment gain of 0.14% (fourteen hundredths of a percent), which would have been an increase of +226,374 jobs in December 2024—pretty close to the actual monthly increase of +256,000.
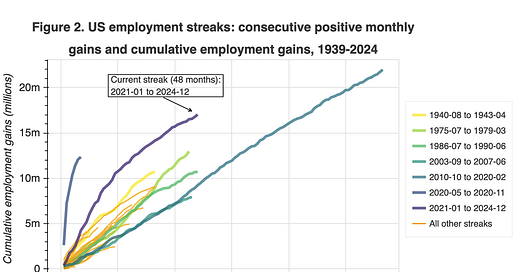
Define a positive employment streak as the number of consecutive months with an increase in employment relative to the previous month. There have been 83 such positive streaks since January 1939. The smallest of these streaks is just one month, representing a positive employment change month that is both preceded and followed by negative employment change (22 of these). The largest of these positive employment streaks is 113 months from October 2010 to February 2020 (see Figures 2 and 3 and Table 1).
Figure 2. US employment streaks: consecutive positive monthly gains and cumulative employment gains, 1939-2024
Figure 3. US employment streaks: consecutive positive monthly gains and average monthly employment gains, 1939-2024
In summary, the US labor market since the end of COVID has been growing at rate that is close to the long-run average rate. But its consistency has been historic. The current streak of 4 years (48 months) of consecutive monthly employment gains is currently tied for second longest. But it will likely stand alone in second place when the January 2025 employment report comes out on Friday, February 7, 2025. We have a long way to go to reach the nearly 10-year employment gain streak of the 2010-to-2020 period, and it is unlikely we will get there. But the average monthly employment gains in our current streak (+354,542) are higher than the other four streaks of more than 40 consecutive months. In a time when inflation pressures, high interest rates, and fiscal worries cloud the economic horizon, the US labor market is a bright spot of strength, resilience, and consistency.
A note on open source resources and replicating these data and images
All the source data and corresponding data visualizations from this article can be obtained and replicated by running the code locally on your personal computer by using the resources in the USempl_Streaks-2025-01 (https://github.com/OpenSourceEcon/USempl-Streaks-2025-01) GitHub repository. Instructions are found in the Jupyter notebook USemplStreaks_2025_01.ipynb in the repository. One advantage of creating the images on your local machine is that the images created with the Python code have more dynamic functionality, including mouse hover-over full data description, muting and unmuting of particular series, zoom, and selection.
See “Employment Situation News Release”, Economic News Release, US Bureau of Labor Statistics, January 10, 2025.
This article is an update of my May 3, 2024 article, “US Labor Market: The Resilient ‘Streak’er”. The data come from the US Bureau of Labor Statistics monthly Employment, Hours, and Earnings from the Current Employment Statistics survey (National), all employees, total nonfarm, seasonally adjusted, 1939-2024 (see BLS data link for series ID CES0000000001 and FRED system data link for series ID PAYEMS). I use annual data for the 1919-1938 period from Table 1 on page 1 of “Employment, Hours, and Earnings, United States, 1909-90, Volume I,” Bulletin of the United States Bureau of Labor Statistics, No. 2370, March 1991. I then imputed monthly total employment amounts for the period 1919-1938 by fitting a cubic spline to the annual data. All data and images can be replicated using the Python code in the USemplStreaks_2025_01.ipynb Jupyter notebook in the USempl_Streaks-2025-01 (https://github.com/OpenSourceEcon/USempl-Streaks-2025-01) GitHub repository.


